Featured Headlines:
The eCommerce Effect: Redefining the North American Free Trade Agreement
Honduras Sets Sights on Increasing Apparel Share by 2020
Industry Eyes Carrier Capacity for 2018/2019
New ILWU/PMA Contract Could Lay Groundwork for New USMX Contract
Port of Los Angeles Adopts New Comprehensive Tracking System
Failure of Sept 1 Transpacific GRI Highlights Ocean Carrier Strategy
U.S. Non-Ferrous Scrap Metal Exports: A Quick Look
Air Freight Boom to Remain Steady
Industry Prepares as ELD Mandate Enforcement Draws Near
Getting Fidgety with CPSC
We’ve all seen them, and some of us even have one, but do you know if a fidget spinner is a “general use” product or a child’s toy? The Consumer Product Safety Commission (CPSC) has issued a business guidance on their website that explains the difference.
A “general use” product is as stated, for general use. Not for children 12 years and younger. The CPSC considers the following when making the determination between the two:
- Marketing materials
- Whether the product and package designs are intended to appeal to a child 12 years or younger
- The age listed on the package
If it is a general use product there are no mandatory CPSC requirements, but if it is a children’s product there are a few:
- Total lead content
- The lead in the paint
- Limits on phthalates
- S. Toy Standard (ASTM F963-16)
- Bear permanent tracking information on the product and the packaging
- Must be tested by a CPSC-accepted laboratory to ensure compliance to this list
Manufacturers and importers have to certify in a Children’s Product Certificate (CPC) that the product complies with these requirements. There is a link on the CPSC website (below) “Children’s Product Certificate Guidance” with a sample certificate that you can use. Once created you are required to provide it to distributors and/or retailers. It must also be included with all shipments and be given to CBP or CPSC, upon request only.
For a list of accepted laboratories along with additional links to the items listed above please go to the CPSC website: https://www.cpsc.gov/business–manufacturing/business-education/business-guidance/fidget-spinners
Finally, the CPSC recommends that all battery-operated fidget spinners comply with the battery requirements listed in the U.S. TOY Standard, ASTM F963-16, Section 4.25, Battery-Operated Toys.
Tracking for CPSC
In case you missed the extremely informative Shapiro sponsored Supply Chain Summer Seminar in Baltimore this past month, then you should make sure your consumer products are meeting the guidelines set forth by CPSC prior to importation. We have noticed a trend in physical exams being conducted by CPSC, and when asked about the most common error, we learned that it was one simple piece of the puzzle: the tracking labels. All children’s products (age 12 and younger) require specific tracking labels. CPSC will be looking for:
- The Manufacturer
- The Date of Manufacture
- The Lot #
- City and Country of Origin
These labels will need to be permanently affixed to the individual products as well as the packaging. The Commission’s definition of permanent is “remain on the product during the useful life of the product.” It will be the importer’s responsibility to make sure the labels are attached with the correct information, but luckily, the first violation will result in a notice while additional violations may result in penalties and delays.
If you’re looking at your small toy products thinking how am I going to permanently affix a label with this information to these items, then you may able to only label the cartons rather than both the cartons and the toy. It will be your manufacturer’s determination if a label can be attached, but remember, the Commission will look at the manufacturer’s situation as well as other similar manufacturers to determine whether the label can be attached or not.
The other error mentioned at the educational seminar was the required testing for children’s products. A certificate will be needed upon request by CBP at the time of clearance. For more information on testing and certifications for your products, check out cpsc.gov or contact us at [email protected]
The eCommerce Effect: Redefining the North American Free Trade Agreement
The expansion of eCommerce has redefined not only how consumers interact within the digital marketplace, but also how nations trade. With the introduction of NAFTA in 1994, the U.S. established Mexico and Canada as its key trading partners. Its implementation increased cross-border trade and has contributed to the growth of the American auto industry. As the U.S. prepares to renegotiate the North American Free Trade Agreement (NAFTA) with Mexico and Canada, modernizing the trade agreement to reflect the eCommerce environment will be key to its continued success.
Today, NAFTA implements strategic duty rates on shipments between the U.S., Mexico, and Canada. When U.S. shoppers purchase goods from either Canada or Mexico, the shipment is not subject to duty until the value exceeds $800. Mexican shoppers pay duty once a shipment from the U.S. is valued at over $50, while Canadian consumers pay duty for shipments over roughly $16. While this encourages U.S. eCommerce customers to purchase goods from Mexico and Canada, this greatly reduces incentives to Mexicans and Canadians from purchasing U.S. goods online.
The Trump administration has proposed several changes to NAFTA that would greatly benefit major etailers – Amazon, eBay, Walmart, etc. Fundamental to this plan is the increased duty threshold for both Mexico and Canada. Enacting a new duty threshold would promote Trump’s “America First” agenda by making U.S. goods easier and cheaper to import to its neighbors. Further, the increased exportation of U.S. manufactured goods would stimulate the economy and increase U.S. job growth.
The proposed duty threshold could greatly benefit the U.S. – but at what cost to Mexico and Canada, and the U.S.’s relationship with its neighbors? Renegotiating NAFTA with a myopic approach would not only be politically contentious but also fiscally damaging.
While Canadian consumers would benefit from the increased limit on a transactional basis, on a broader scale the change would decrease purchases of Canadian goods. Karl Littler, of the Retail Council of Canada, actively criticizes the plan as it would “make absolutely no sense, economically, for Canada…it would be a tax incentive for Canadians to shop literally anywhere else but here.” Moreover, this would put Canadian retailers at a competitive disadvantage upwards of 10% with the elimination of the duty and taxes for cross border shipments under the proposed $800 value. Implementing this change would be detrimental to the Canadian economy.
Mexico faces fiscally destructive risks with the proposed NAFTA updates. While Trump has retreated on his threatened 25-35% duty on Mexican-made goods, the import threshold change is no less concerning to Mexico. The developing economy could easily be flooded by cheaper imports from Asia. Mexican Economy Minister Ildefonso Guajardo, a strong opponent of the change, argues this “opens a completely unnecessary door” to imports from outside the NAFTA trading bloc to bring its manufacturing to a standstill. Though tensions between the U.S. and Mexico remain, it does appear Mexico is willing to negotiate with President Trump.
As negotiations continue, the U.S., Canada, and Mexico will need to work to establish mutually beneficial import and export practices. While the Trump administration champions an “America First” approach, how well this strategy will fare in the global environment remains to be seen. Compromise will be critical to maintaining the flow of trade; the failure to compromise could mean the end of the free trade era and increased duties on all shipments between these nations.
Honduras Sets Sights on Increasing Apparel Share by 2020
As suppliers continue to develop go-to-market strategies to keep up with consumer trends, sourcing options and costs continue to be at the forefront of the discussion. While Central America has picked up momentum as a faster sourcing option for U.S. companies, Honduras is positioning itself to grow their market share by 2020. They have since formed and launched an economic transformation unit dubbed Honduras 2020. Their function will be to attract and facilitate investment in the textile and apparel industry within Honduras by highlighting the many benefits the region has to offer.
While Central America is still an underdeveloped region and there may be concerns in regard to political stability, the region can offer many benefits in terms of sourcing. Reduced transit times and shipping costs are two benefits based on the closer proximity Honduras has to the U.S. In addition, now that the Trump administration has pulled out of the Trans-Pacific Partnership (TPP), many optimistic investors will turn to Central America in an effort to benefit from the Central American Free Trade Agreement (CAFTA) while also utilizing a highly productive labor force.
Over the next few years, Honduras plans to add capacity and capabilities to its manufacturing facilities, introduce renewable energy plants, expand its logistics infrastructure at Port of Cortes and provide export pre-clear security for the United States. Recently, as an outcome of the country’s competitive advantages, an investment of $78 million in a synthetic yarn plant is expected to manufacture 20,000 tons annually. In addition, the country has implemented the largest solar roof installation in Latin America.
In 2016, the U.S. imported $2.57 billion worth of textiles and apparel from Honduras. However, Honduras 2020 has a vision to position the country as the leading textile exporter in the Americas delivering to the U.S. and Europe and reaching a total of $7.4 billion in exports. While there are many benefits to sourcing from Honduras and Central America, it will be interesting to see how politics in the U.S. and Central America have an impact on the global trade between regions.
Industry Eyes Carrier Capacity for 2018/2019
Despite the steamship purchasing binge that saw the industry add millions of containers of capacity over the last three years primarily by ordering tremendously larger vessels, ocean carriers have controlled the growth of capacity to only 7% in 2017. This was done primarily through scrapping and greatly decelerating the purchase of new vessels beginning in 2016.
Though they currently deny it, it appears likely that CMA-CGM has just purchased 9 vessels with over 20,000 TEU capacity, an injection of 200,000+ container capacity which would double the order book for 2017. Many analysts fear this is a sign that ocean carriers are being lured by severely depressed pricing for steamship production. Additionally, there are 78 vessels of 14,000 container capacity or more currently in production and due to be put in service between now and the end of 2019. Still, the steamship industry claims that they can contain capacity expansion to 7% in 2018 and less than 2% in 2019.
While all shippers love a bargain, many importers and 3PLs have publicly expressed their desire for a healthy steamship industry with a healthy number of ocean carriers to promote competition and service differentiation. It is essential that the ocean carriers curb their appetite for vessels and additional capacity. Most experts project global shipping demand to end 2017 at least 6% higher than 2016, and this is great news for the steamship industry; however, there are no guarantees that this kind of momentum is sustainable into 2018.
As we “celebrate” the one-year anniversary of the Hanjin collapse (August 31, 2016), the shipping, forwarding, and steamship industries watch carrier capacity closely for the first clues for 2018 and 2019’s likely market realities.
New ILWU/PMA Contract Could Lay Groundwork for New USMX Contract
On July 28th, the International Longshore and Warehouse Union (ILWU) announced that they had approved a three-year extension to their current labor contract. This extension moves the end of the contract date out to July 1st, 2022 and should lead to five years of labor stability on the West Coast.
This agreement with the Pacific Maritime Association (PMA), which manages terminal operations, is the culmination of preliminary talks which started in the spring of 2015. Those early talks came on the heels of a protracted and difficult negotiation to the initial contract signed that spring. Those negotiations involved work stoppages and allegations of labor “slow-downs” which led to extreme delays in the movement of cargo throughout supply chains for many months and reverberated throughout the economy.
Coming off of that experience, this extension is a welcome sign that all parties are focused on ensuring that cargo moves swiftly and reliably through West Coast terminals. On the labor front, all eyes now shift to the negotiations between the International Longshoremen’s Association (ILA) and the United States Maritime Alliance (USMX) whose contract is set to expire on Sept, 30th 2018. Informal meetings between the two parties have already commenced.
Port of Los Angeles Adopts New Comprehensive Tracking System
The Port of Los Angeles is on the verge of launching a new $13 million tracking system designed by General Electric. The new system will allow the nation’s largest and most active port to be at the forefront of a hefty modernization initiative that will ease confusion and increase efficiency throughout all Los Angeles port operations.
Though the final contract details have yet to be confirmed, it appears that 6 terminals and 15 carriers will be included in the initial rollout. A beta test version of the new system was run at APM Terminals at the port of Los Angeles earlier this year with John Ochs, the Senior Director at APM, describing the test as a definite “home run.”
The new system, which has yet to be named, will allow cargo and packages to be tracked from a single source throughout the entirety of the supply chain involving the port of Los Angeles. This will provide ample clarity and transparency to a process that has been historically murky and currently involves manually connecting the dots between a myriad of disconnected systems. In-depth details about system capabilities are not yet available, but it has surfaced that the new system is capable of providing data two-weeks prior to arrival, whereas current systems typically provide data only 2 to 4 days in advance of cargo arrival.
The new system may be in competition with tracking services offered by some forwarders, carriers and truckers, but the final result should only further aid all providers in creating greater visibility and efficiency.
Failure of Sept 1 Transpacific GRI Highlights Ocean Carrier Strategy
Despite impressive vessel utilization scores of 95-100% for U.S. imports, ocean carriers were unable to impose a General Rate Increase (GRI) on September 1st as announced. Many analysts point to three main factors to explain the unusual combination of surging demand and flat pricing:
- Use of extra loaders/charter space. The charter vessel industry has been hit very hard over the last several years as ocean carriers struggled to fill their own ships and had little need of extra space. This makes charter space cheap just as ocean carriers vie for highly valuable time-sensitive retail goods. Extra loaders inject short term space into the market which gently increases supply/capacity.
- Carrier costs. As cost improvements from larger vessels, from more fuel-efficient vessels, and from better managed alliances take root, ocean carriers are content to do a bit better on the spot market vs. contract rates and play for market share. The industry is forecast to make $5B in 2017, and this prosperity allows carriers to focus more on reliable service and transit times.
- The Danish giant lost valuable business after they were victims of a cyber-attack. Maersk has been highly aggressive with rates to attract former accounts and volumes. The other ocean carriers are loath to increase rates at this critical juncture.
All eyes are on the September 15th GRIs and Peak Season Surcharges. It seems unlikely that the current near-equilibrium between demand and supply can continue. The combination of Golden Week supply chain disruptions from Oct 1-8 and the final U.S. holiday cargo push will likely push spot rates up by $200-$800 in the near future. If the current greed for market share dominates the market, we’ll be closer to $200-300 increases.
U.S. Non-Ferrous Scrap Metal Exports: A Quick Look
Based on trade details from the U.S. Census Bureau, U.S. exports of major non-ferrous scrap metals (Cu, Al, Ni, Pb, and Zn) increased by 12.4 percent to 1.1 metric tons in the first 5 months of 2017 versus the same period the year prior.
Lead metal scrap exports represented the largest increase in this segment at +20.3%, followed by copper scrap at +13.1% and aluminum scrap at +12.8%.
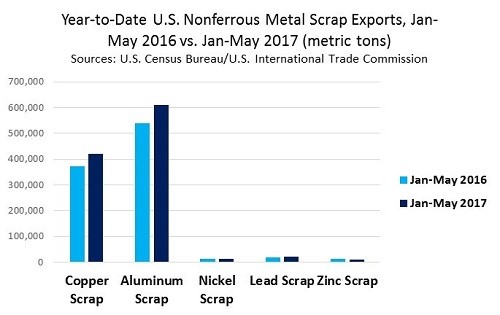
*Above graph from 28-July-2017 ISRI “Non-Ferrous Beat”
A sharp increase in Chinese consumption of copper and aluminum scrap was the main factor contributing to the significant year over year growth in overall U.S. non-ferrous scrap exports.
Based on comments from journalist Adam Minter at ISRI 2017 in New Orleans (from July/August Scrap Magazine), China is a still a big influence on the global scrap trade despite its waning appetite for scrap. In the coming years, however, developing countries will start participating more in the market, which will open up more trade routes—and introduce more competition.
Other countries are poised to become bigger players in the scrap trade, including countries in the Association of Southeast Asian Nations (Brunei, Cambodia, Indonesia, Laos, Malaysia, Myanmar, the Philippines, Singapore, Thailand, and Vietnam). China has subsidized infrastructure in the region in order to link these countries to its trade routes, Minter said. China also has turned its attention to trade in Kenya and other African nations.
U.S. exporters of non-ferrous scrap metal will likely find new markets supported by Chinese-owned scrap processors in the coming decade. Other current significant non-ferrous scrap markets for U.S. exporters include South Korea, Mexico, Canada, and India.
Air Freight Boom to Remain Steady
The airfreight market, which has maintained its volumes in 2017, will likely remain busy throughout the rest of the year. Per the most recent Broughton Capital index, the Asia-Pacific lane has grown 12.3% overall. Without a doubt the Asia-Europe trade reveals the most outstanding numbers and a positive trend toward growth of the mode. Supporting data show traffic between major hubs increased more than 3% (FRA, LHR, AMS) to 16.6% (HKG). Meanwhile, Latin America has shown some recovery by launching several domestic flights via LATAM Airline and through the new international Europe-Mexico service, offered by CargoLogicAir (the UK all-cargo airline).
The increased volume of e-commerce shippers has injected greater urgency to the process, requiring faster delivery times and leading to a modal shift from sea to air. The air community has understood this very well by welcoming the business-to-consumer market but imposing solid mark-ups, which is expected to continue. The average cost across the board for the main 28 east-west trade lanes by the end of July was $2.64/kg, a number seen in April of this year courtesy of data from the Drewry East-West Airfreight Price Index.
In summary, space is tight, rates are steady at these high levels, and this should continue through September’s peak season.
Industry Prepares as ELD Mandate Enforcement Draws Near
The December 18th implementation date for the electronic logging device (ELD) mandate is drawing near. This requirement, which is looking to reshape the trucking industry, will unarguably affect trucking capacity. The most likely short term effect relates to tightening “hours of service” (HOS) enforcement. The FMCSA’s final rule on ELDs will require all interstate truckers to use an electronic device to record the hours of service. All commercial trucks currently using paper log books to maintain HOS records need to adopt ELDs by the end of 2017. This new mandate doesn’t change any rules related to hours of service; it simply changes how those hours need to be recorded.
Even with the deadline fewer than four months away, many small carriers and owner operators are still waiting to install ELDs. Per a recent survey performed by Fleet Owner magazine, only 53.5% of trucking companies are expected to be ready for the Dec 18th deadline, and only 33.7% of the carriers polled are fully compliant.
In a recent statement, the Commercial Vehicle Safety Alliance clarified how the mandate is going to be implemented, announcing an enforcement date of April 1, 2018. This new announcement gives truckers more time to prepare and adjust for the new requirements.
ELD usage is not new to the industry. Some carriers have been using these electronic devices for years, already taking advantage of the benefits these bring to everyday operations. Many of the ELD systems are able to provide additional data allowing carriers to better dispatch their loads, tracking fuel mileage and driver performance. Even basic ELD products will take away the need to manually fill out their paper logs, saving time and improving accuracy. The trucking industry’s move to electronic logs will likely garner stricter compliance with driver hours-of-service rules.
If shippers do not work with brokers and carriers to ensure their transportation partners are ELD complaint, they are going to have problems moving their cargo. Even though the ELD rule has endured court challenges in the last months, the rule will be enforced and drivers without ELDs can be placed out of service by roadside inspectors.
Understanding EDI
The acronym EDI stands for Electronic Data Interchange. Most of us know that much, but it is truly remarkable how few companies fully take advantage of a tool that has existed for over 30 years now. The benefits of EDI are in streamlining business processes so that less human intervention is required. And, without intending insult, EDI exchanges allow data sharing without inaccurate human intervention. There are many different formats that can be used to exchange data; popular methods are XML (Extensible Markup Language), delimited files, flat files and ANSI X12 format.
XML files are in a format that can be read by humans and by machines. Each data element will have tags to let you know what it is. Delimited files have data appearing in the same order in each record, and the different fields are separated by a character to determine when data for the next field starts. Like an Excel file saved in csv format, a delimited file will often have data separated by commas. Flat files are files of a defined record length made up of fields that have an exact beginning and ending point within the file. ANSI X12 format was created by the American National Standards Institute, and the institute has defined different transaction sets that can be used to transmit data back and forth. Transaction set 856 sends Ship Notices/Manifests, 300 is a booking request, and there are many more.
The format you choose depends on what resources you have. This could be human resources or software that creates data files for you. Your business partner may dictate the format in which they want to receive or send the files. There is no unique way that data can be sent using EDI which allows for simple standardizations and quality controls. Whenever you or your staff spend significant hours converting emails and email attachments to data records, you are in the presence of a great opportunity for EDI streamlining.
Employee of the Month
As previously featured in Shap Talk, Shapiro has been sharing with you the names of employees who have been recognized for their exceptional efforts and contributions to our Company. At Shapiro, we continually work to develop, challenge, and inspire all of our employees to grow individually and with the Company. This month, we would like to recognize Genia Blades, Import Supervisor in Baltimore for her outstanding performance and contributions.
We encourage you to provide us with employee feedback! Please email us at [email protected].