Port and Rail Congestion Get Carriers Off Track
Supply Chain Reactions
A Condensed Update For American Shippers
Issue Date: January 15, 2021
Quote of the Issue:
“You can’t calm the storm, so stop trying. What you can do is calm yourself. The storm will pass.”
– Timber Hawkeye
US Domestic: Port and Rail Congestion Crippling Service Levels
ShapLight Focus: Dray carriers are requiring bookings at least 12 days in advance for Savannah, Norfolk, Baltimore, New York, Atlanta, and Memphis
- Average truck turn times at major US ports have increased every single month since June
- Surging import volumes, dysfunctional port operations, and chassis imbalances have led to rail delays of 17 days in Los Angeles and 9 days in New York
- Drayage rates spiked in December and are expected to do so again in January as trucking operations are unable to complete jobs efficiently
- In three months, diesel fuel rates have increased 5%, which will affect fuel surcharges in early 2021
- DAT reports that there were 4.21 loads per available FTL truck at the end of December; this index has now exceeded both 2018 and 2019 levels for the same months for six months in a row
Government Corner: Will Trump Impose 301 Tariffs Globally?!
ShapLight Focus: Through the office of the US Trade Representative (USTR), the Trump Administration has announced possible 301 actions against Turkey, India, Italy, and France; however, they also delayed the imposition of additional duties (25%) on French luxury goods
- The Federal Maritime Commission (FMC) continues to investigate the role ocean carriers are playing in restricting empty containers that US exporters need in order to ship their products; the carriers prefer to quickly transport empty containers back to Asia where freight rates are at historic highs
- The Trump Administration designated Cuba as a state sponsor of terrorism; this will almost certainly halt all commercial trade between the US and Cuba for the foreseeable future
- The Generalized System of Preferences (GSP) and Miscellaneous Trade Bill (MTB) programs have expired and are not expected to be renewed until well into 2021; though the additional duties are expected to be refunded retroactively, the added strain on importers’ cash coincides with tripled freight costs in many markets
- The vast majority of 301 duty exclusions have now expired, with only PPE products continuing to be eligible for exemptions
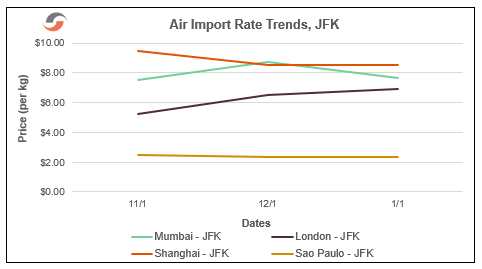
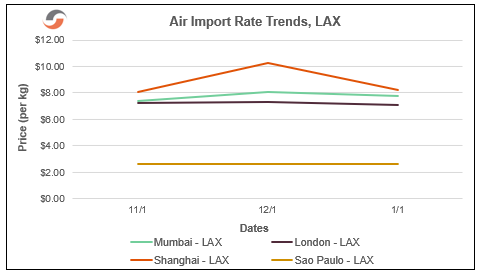
Airline Cargo Revenues are Up, though Volumes are Down
ShapLight Focus: Total airfreight volume was down 12.6% in 2020 vs 2019 while revenue yields were up 11.2%; with the loss of passenger belly space diminishing capacity by more than 25%, airlines were able to raise freight rates by 28% in 2020
- The trade expects the block space agreement (BSA) system to re-emerge in 2021; airlines are beginning to offer monthly and quarterly pricing through BSAs, after shifting to a daily spot rate environment in 2020
- Industry pundits estimate that COVID vaccine transportation will account for just 2% of total air cargo volume in 2021
- The International Air Transport Association (IATA) announced that they do not expect the passenger fleet grounded by the pandemic to return to its previous scale until 2024
- Amazon has purchased 11 Boeing cargo airplanes and plans to add them to their transportation network by 2022
- Qatar Airways and China Airlines are the latest airlines to add 777 freighters to their fleets; the industry has quietly witnessed a 10% increase in freighter capacity as airlines position themselves to survive in 2021 on freight operations
Please note the following three-month airfreight rate trend charts:
Sea Ports and Ocean Carriers Setting Volume Records
ShapLight Focus: 1.96 million import containers are projected to arrive at major US ports in January per Global Port Tracker; this is the highest total recorded in US history
- The Chinese government is encouraging factories in South China to release workers early for Chinese New Year (CNY) in an attempt to limit COVID exposure; this is highly unwelcome news for US importers already facing tremendous supply chain delays and costs
- Note: Chinese citizens are expected to make 3 billion trips during CNY (2.5 billion by car or bus, 450 million by train, and 50 million by air)
- After blanking 20% of capacity during CNY in early 2020, the steamship industry has announced blank sailings representing just a 2% reduction in shipping capacity to date
- There are currently 35 cargo ships at anchor awaiting berths at the ports of Los Angeles/Long Beach (LA/LB)
- The industry has witnessed ocean carrier “slidings” in lieu of blank sailings; the carriers have been forced to stretch sailing schedules and swap origin and destination ports on established routes to adjust to extreme port congestion and dislocated equipment realties
- It has been a violent winter in the Pacific Ocean, and at least four vessels have been damaged and lost containers overboard thus far
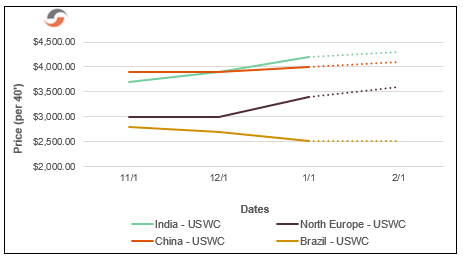
Ocean Freight Import Rate Trend Charts
Ocean Import FAK Rates to US West Coast (per 40’):
Ocean Import FAK Rates to US East Coast (per 40’):
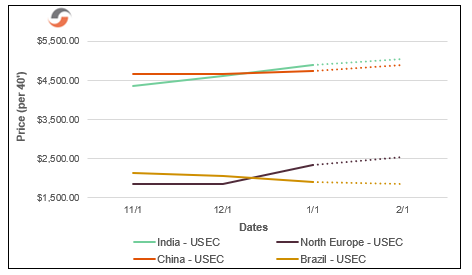
Transpacific Forward Rate Projections (per 40′):
Our Expert Shapinion
The Shanghai Containerized Freight Index is Meaningless
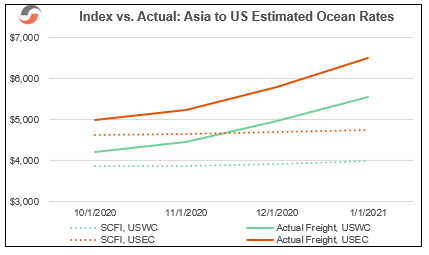
Since 2005, most importers and forwarders have been using the Shanghai Containerized Freight Index (SCFI), and most of us have come to trust the index to help us understand if our contracts and rates are competitive. In fact, many importers establish contract rules with NVOs and forwarders that depend on our trusted friend – the Shanghai Index.
The unprecedented shipping realities starting in October 2020 and powerfully accelerating through December and into 2021 have claimed another victim. The SCFI is currently meaningless.
How can it be? How can one of our truly beloved market tools become irrelevant in a mere two or three months?
The answer, my friends, is blowing in the wind of premium surcharges. And “surcharge” is the key word here.
Somewhat cleverly, ocean carriers have rebranded ocean freight as a premium surcharge. Not only does this remove some governmental scrutiny over rates, but it also helps importers feel that they are receiving something special for their (piles and piles of) money. At the end of the day, however, premium surcharges are just a form of ocean freight. And frankly, only two or three ocean carriers should be allowed to call what they are selling a “premium” service.
Two things have happened to make the SCFI irrelevant:
- We now see over 60% of the container volume moving on premium services (with premium surcharges), with approximately 30% still moving on historically high FAK rates and 10% on fixed rate service contracts.
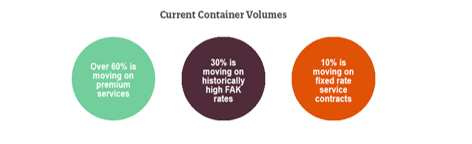
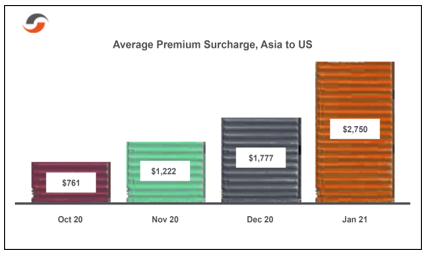
- Those premium surchages have Tripled in the last two months.
So, at present, the SCFI is a valid measure for less than one-third of imports from China, and our reliance on the index is misleading since it masks the true state of shipping from Asia as we begin to dive into 2021.
Peter Tirschwell recently characterized today’s reality as “the global deceleration of container flows”, and boy is he right. Therefore, it is essential that we really understand that we are paying for the right to sit still and accumulate surcharge after surcharge (and delay after delay) in our supply chains.
Chart of the Issue:
Please note our best estimates for the true cost of shipping from greater Asia below:
Shap Fact of the Issue:
US real domestic product (GDP) rose 33.1% in the third quarter of 2020 after declining 31.4% in the second quarter.
The leadership and staff of Shapiro understand the personal and business anxiety each of you is experiencing. We want nothing but safety today and a return to normalcy tomorrow for you and your families. Please reach out to us if you have any questions—or if we can assist you in any way.