Tricks of the Trade: Why Shippers Need Cargo Insurance
Shipments in transit are subjected to numerous perils; goods may be damaged in a storm or fire, stolen by ghosts in the night, involved in a collision, or just plain mishandled, much like the ill-fated journey in “Deliverance.” To help protect against financial loss or another frightful travesty, shippers should consider obtaining Shipper’s Interest Cargo Insurance.
Many folks mistakenly believe that standard carrier insurance will protect their shipments, but this is not always the case. Carriers do not pay claims unless they directly cause or contribute to the loss. Even when carriers are legally liable for loss or damage, the amount they will pay is limited based on the mode of transport, leaving shippers vulnerable to the lurking dangers of the logistics world—where the only thing scarier than a horror movie is an uninsured shipment!
Ocean Freight
The Carriage of Goods by Sea Act (COGSA) governs carrier liability for goods shipped via ocean to/from the United States. Recovery is limited to $500 per customary freight unit, and only when the carrier is negligent. A “freight unit” can vary from one container to one pallet.
International Air Freight
For air carriers, two liability conventions exist:
- Warsaw Convention: Limits liability to $9.07 per pound or $20 per kilogram.
- Montreal Convention: Used in the United States, this convention changes the limitation to 22 Special Drawing Rights (SDRs), or about $30 per kilogram.
Domestic Shipping
Many domestic air, intrastate road carriers, and warehouse operators limit their liability to $0.50 per pound or $50 per shipment, based on their bill of lading or warehouse receipt. Interstate truckers are governed by the Carmack Amendment, which dictates full value but allows limitations of liability in bills of lading, tariffs, or contracts. Some carriers will also have inadequate or no liability insurance and may be unable to fund a loss out of pocket.
Trick-or-Trade: Declared Value vs. Cargo Insurance
Declaring value to a carrier is not the same as having Cargo Insurance. In order to submit a claim against a carrier, the shipper must prove that the cargo was damaged while in the carrier’s care, custody, or control. The carrier then has multiple defenses to prove they weren’t liable, making recovery extremely difficult. Cargo Insurance provides protection without having to prove carrier liability. This is particularly important in instances where a loss is attributable to an “Act of God,” which seems to be a regular occurrence in recent years.
| Examples of Claims | Description of Loss | Declared Value for Carriage | Cargo Insurance |
| Lightning Strikes a Truck | While a trucker was en route, the truck was struck by lightning, causing a fire and resulting in a total loss of the cargo. | Even if a value is declared, there would be no automatic right or recovery because the trucker did not act negligently. The loss was considered an “Act of God.” | This type of claim would be paid under “All-Risk” Cargo Insurance coverage. |
| Heavy Weather at Sea | Several days after an ocean vessel left the port, it ran into heavy weather. A large wave hit the vessel, and containers were washed overboard. | “Heavy Weather” is excluded under COGSA. The ocean carrier would deny liability, and no payment would be forthcoming. | This type of claim would be covered by “All-Risk” Cargo Insurance, as well as With Average (WA) coverage. |
The Haunting Truth: Why Cargo Insurance is Essential
Cargo Insurance not only covers loss or damage but also protects against General Average, pays for the costs to minimize a loss (lawsuit and labor), and pays for damage inspection (survey). Carriers have limited liability and are provided legal defenses that can absolve them of responsibility entirely. Cargo Insurance pays covered claims without the need to prove fault.
What is General Average?
Before we answer our own question, a history lesson! The concept of General Average began when sailing the oceans blue was a very hazardous journey in smallish “sailboats.” When there wasn’t a shipowner to be found to move valuable goods, the risks of those voyages had to be shared by shipper merchants and vessel owners. Despite the relative safety of today’s commercial flotilla, though a vessel a day still sinks (!), General Average is alive and well and has been since the Greeks and the Romans ruled the Earth,
General Average is a principle incorporated into virtually all ocean bills of lading. It is used when a voluntary sacrifice is made to save the vessel, cargo, or crew from a common peril (e.g., jettison of cargo to extinguish a fire or maintain balance in a storm). All shippers on-board contribute to the loss based on their cargo’s value. If the cargo isn’t insured, it won’t be released until the shipper posts a guarantee (cash, bank guarantee, or bond). If the cargo is insured, the insurance company will handle all arrangements on the shipper’s behalf.
For a more in-depth look at General Average check out our blog.
Cargo Theft
Estimates of cargo theft in the United States range from 15 to 35 billion dollars (USD) annually. Officials estimate that nearly 80% of cargo thefts involve employee collusion. Drivers are often paid to leave their truck unattended at a specific place and time.
Statistics:
- Within 24 hours of theft: The goods are already delivered to an alternate location. Thieves are no longer in possession of the merchandise.
- Within 48 hours of theft: Cargo is split into about five consignments and distributed.
- Within 72 hours of theft: Goods are being marketed and sold.
Spooktacular Cargo Insurance Coverage Options
Shapiro offers comprehensive “All-Risk” coverage for cargo in transit, including Free of Particular Average (FPA) and With Average (WA) alternatives.
“All Risk”
Provides the broadest form of protection available. Goods are covered for loss or damage without the need to prove liability. An easy way to remember “All-Risk” coverage is “everything is covered, except what is excluded.” Typical exclusions include improper packing, inherent vice, or rejection of goods by Customs.
Free of Particular Average (FPA)
Offers less protection than “All-Risk” coverage but is a good option for commodities like used goods, waste materials, and scrap metal. A good way to remember FPA coverage is “the only covered losses are specifically named.” Perils covered under FPA include sinking, collision, General Average, fire, and washing overboard, to name a few.
With Average (WA)
Extends FPA to cover heavy weather. Many shippers choose to add theft, pilferage, and non-delivery to WA and FPA.
In a nod to the season, we wanted to end on a “ghoul” note. If you or your business have fallen into one of the perilous pitfalls mentioned above—or simply avoid them all together—consider “trick-or-trading” in your Cargo Insurance provider for Shapiro!
Additional Resources:
- Cargo Insurance: What is General Average
- Cargo Insurance: 4 Common Misconceptions Debunked
- Cargo Insurance Coverage Options
Imagine receiving a message from an ocean carrier notifying you that all the cargo aboard a vessel, including yours, has been impounded—and the only way you can retrieve it is a boat load of cash or a guarantee at the very least. Sounds like extortion, right? Well, it’s actually a very common event in maritime shipping known as General Average. Understanding General Average, its implications, and how to protect yourself as a shipper is crucial in the world of ocean freight shipping. So, let’s dive right on in…!
What is General Average?
General Average is a principle of maritime law establishing that all cargo owners on a vessel share liabilities and losses that may occur. This means if a shipper’s cargo is involved in such an incident, even if their goods are not damaged, they must still contribute financially to the loss.
The Basics of General Average
General Average may be declared when an intentional sacrifice is made to preserve the common safety of the ship, persons, or property while at sea. For example, if a ship is in peril and the crew jettisons some cargo to lighten the vessel and save it from sinking, the losses incurred are shared among all cargo owners with a financial interest in the voyage.
The Financial Implications
When General Average is declared, all shippers on a vessel must contribute to the loss, regardless of whether their cargo was directly affected. The amount they’re expected to contribute is based upon the total value of the ship’s cargo.
Here’s an example scenario for you:
- Total value of the voyage: $200 million
- Total loss (cargo and vessel repairs): $20 million
- Percentage of loss: 10%
- Cargo owner’s contribution: 10% of the value of their cargo.
Given the above example, if a shipper has cargo valued at $100,000, they will need to contribute $10,000 to get it released.
Recent Examples
The principle of General Average is not just theoretical; it happens in real life. And it happens more often than you think. The two most prominent cases in recent memory are the Ever Given and the Dali.
Ever Given: On April 1, 2021, the Ever Given’s vessel owner, Shoe Kisen, declared General Average. In case you might’ve forgotten, the Ever Given ran aground in the Suez Canal on March 23, 2021. With the assistance of 13 tugboats and dredgers, the vessel was successfully refloated on March 29th. The incident caused a blockage of the Suez Canal and halted cargo traffic, delaying billions of dollars’ worth of shipments. The vessel was held for three months by the Suez Canal Authority while they worked to determine total liabilities. General Average was declared at 25%. Once the financial dispute was settled between the shipowners and the Suez Canal Authority, the vessel was allowed to leave.
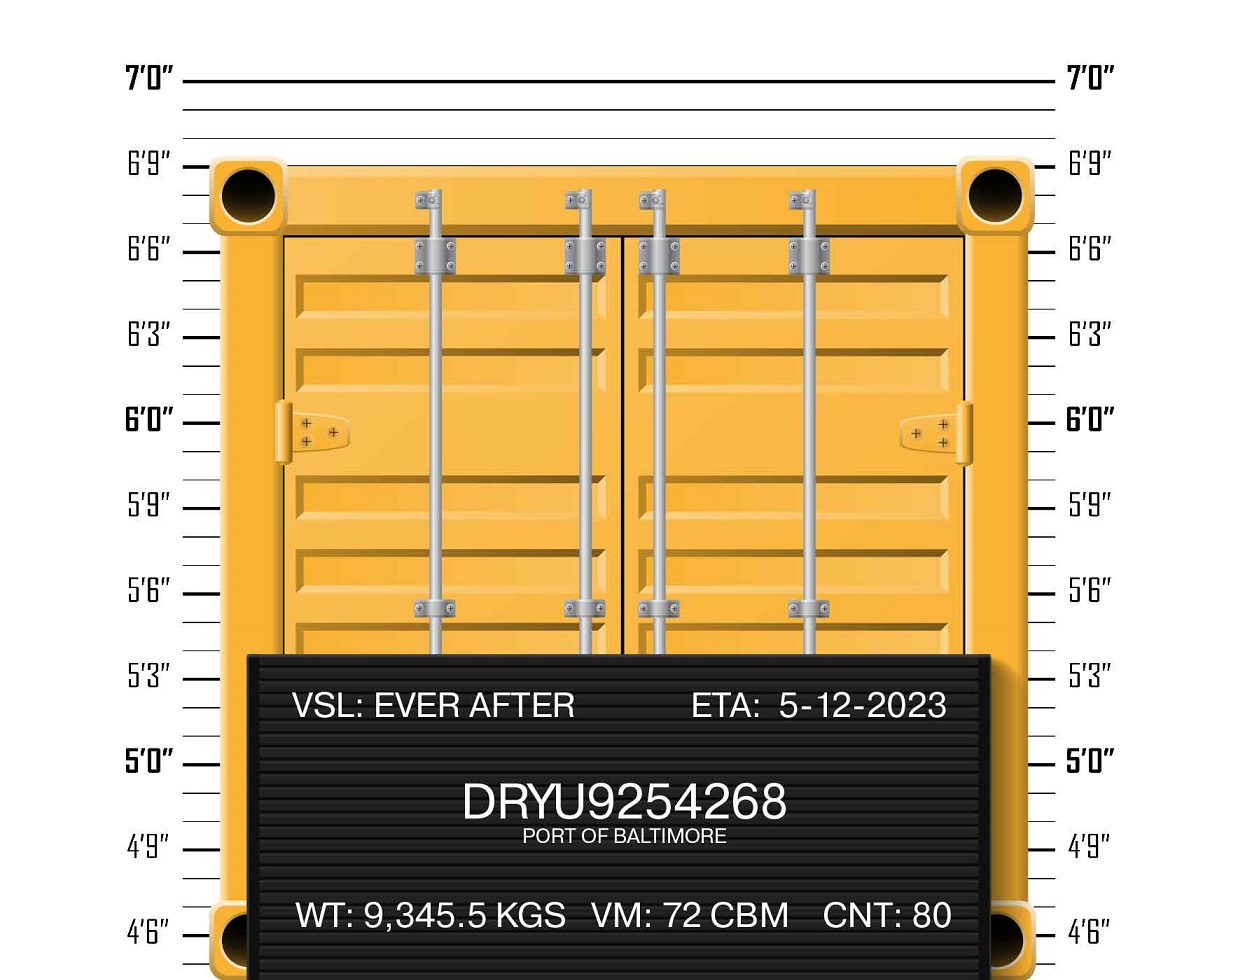
Dali: Grace Ocean Private Ltd, the owner of the Dali—the infamous ship that knocked down the Francis Scott Key Bridge in Baltimore in March 2024—declared General Average a month after the initial incident. At the time of the crash, there were over 9,000 TEUs onboard the vessel, which became stuck inside the Port of Baltimore for several weeks. It will likely take some time for a value to be declared as cargo and damages must be fully inspected. But you can bet your bottom dollar that the figure isn’t going to be pretty!
Protecting Yourself: The Role of Cargo Insurance
Uninsured Cargo: If your cargo isn’t insured, you will not be able to retrieve it until you post a guarantee, which can be in the form of a cash deposit, bank guarantee, or bond. This can significantly impact cash flow and delay your business operations.
Insured Cargo: Having marine cargo insurance can mitigate the financial strain of a General Average declaration. When General Average is declared:
- Immediate Notification: Notify your marine cargo insurer immediately.
- General Average Guarantee: The insurance company will post the General Average Guarantee to meet your contribution and facilitate the release of your cargo.
Insurance can be a make or break in this situation. Not only does it ensure the quick release of your goods, but it also protects and insures you from the financial burdens associated with unexpected maritime events.
Why Shippers Need to Be Aware
Understanding General Average and the role of cargo insurance is essential for any shipper involved in international trade. This knowledge can prevent financial losses and ensure smoother business operations in the face of maritime accidents.
Also, many shippers are under-insured, especially for maritime events. Please do not presume your property policy’s marine clause fully protects you!
Most companies offer cargo insurance, but how many offer you assurance? Whether your cargo is on-shore or off-shore, Shapiro procures, ensures, endures and assures. That might sound like a mouthful to you, but that mouthful could save your bacon—and your bottom line!
Helpful Links:
- Cargo Insurance: What is General Average
- Cargo Insurance: 4 Common Misconceptions Debunked
- Cargo Insurance Coverage Options
Pay attention, Agents…
Your mission, should you choose to accept it, involves decoding the latest updates to U.S. Customs Bonds—the unofficial and secret weapon that U.S. Customs and Border Protection (CBP) and other Partner Government Agencies (PGA) have at their disposal to safeguard our national trade interests.
Much like the legendary MI6 Agent 007 from across the pond, James Bond, Customs bonds operate behind the scenes to protect and serve. But fear not fellow agents, for this mission briefing won’t require any covert spy operations, stirred pots, or shaken martinis for that matter.
The License to Bond
First off, let’s revisit the basics. Like any experienced spy, Customs bonds are all about security. They guarantee that all duties, taxes, and fees owed to the government will be paid. In the complex world of international trade, you can consider these bonds your “license to ship”—without them, your cargo can’t clear Customs.
From 1991 with Love
The story of Customs bonds can be traced back to 1991, when the original guidelines were first codified. However, like any good spy gadget, periodic updates are essential to keep pace with the ever-evolving threats and changing landscape of today’s world.
Since 2020, CBP has embarked on a top-secret revision mission, spurred by the need to adapt to new economic realities and technological advancements. These necessary changes reflect a forward-thinking approach, propelling the bond process to become more transparent and adept to meeting the needs of current trade volumes.
After all, even “Q” knew it was necessary to continually upgrade his gizmos to keep up with the challenges of modern espionage—erm, we mean international trade, that is.
A Quantum of Updates
Highly anticipated by the international trade community, the latest batch of updates aims to “mind the gaps” and clarify some of the murkier waters of bond coverage. Some of these key changes include, but are not limited to:
- eBond Upgrades: CBP officials now embrace modern technology with electronic bond (eBond) transmissions—making them fast (but not furious), efficient, and ready at the click of a button.
- Dangerous Merchandise: A new section in Appendix A identifies special classes of merchandise that pose risks—spelling out the required bond amounts for hazardous cargo.
- Bond Increments: All continuous bonds are now set in increments of $10,000 up to $100,000; capping at $100,000 for larger bonds.
- Minimum Bond Hikes: The minimum C3 and C4 bond amounts doubled from $25,000 to $50,000.
A Mission Debrief on Your Gadgets & Resources
If you have any questions, you are not alone! Never fear—Shapiro is never one to lead you astray.
For those of you agents who feel the need to dive deeper into the intricacies of these updates, you may want to consider a quick visit to the CBP Bonds website, which boasts a summary of changes and other detailed guidance. But beware—this is your detailed dossier, so handle it wisely.
We also encourage you to reach out to CBP’s Trade Policy and Programs, Drawback and Revenue Branch at [email protected] with any burning questions. These folks play the role of “M” in our Bond scenario…so don’t be afraid to reach out to these experienced agents for more guidance.
The Trade World is Not Enough
In our modern international trade world—where the flow of goods never sleeps and threats to efficient trade loom large—staying informed about Customs regulations is not just important, it’s mission critical. Updates to Customs Bonds are not just bureaucratic red tape; they’re enhancements to the tools that keep our trade operations alive and well.
In closing, remember—much like the suave hero of our favorite spy films (or spy novels if they float your boat), staying cool, calm, collected, and informed under pressure is the hallmark of a successful logistics and shipping professional today. So, gear up, for the magical and prolific world of Customs Bonds awaits. And as always, keep your shipments moving and your wits about you!
…Until next time, Agents.
Helpful Links:
Lately, the international trade newsroom has cast a bright spotlight–or should we say dark shadow–on some of the shadier business practices allegedly leveraged by certain popular e-commerce platforms.
If you were one of the 123 million viewers that tuned into Superbowl 58, chances are you caught a glimpse of at least one of the six commercials aired by Temu, an e-commerce retailer based in China.
But how did Temu manage to allocate such a hefty sum towards its marketing budget given its rock-bottom prices on everything from 3D chicken nugget pillows to seasonal holiday decorations? Simple. It’s likely the result of the retailer taking advantage of a US import tax loophole known as de minimis.
Maximizing the De Minimis Exception
Before we kick-off, let’s take a moment for a quick warm-up stretch to jog our muscle memory. If you’re wondering what the de minimis loophole is, think of it this way:
You have a piggy bank in your room. Every time you deposit more than five coins, you have to give one extra coin to your mom or dad for taxes. However, you don’t have to pay the additional tax on any deposits made containing five or fewer coins. Instead of making one large deposit of say, 20 coins, you could make four individual deposits of five coins to avoid paying the additional tax.
Some e-commerce companies are running a similar game when it comes to de minimis shipments.
If an importer brings goods valued at more than $800 into the US, they are typically taxed by the government. However, retailers like Temu and Shein attempt to circumvent import taxes by shipping directly to the consumer, thereby avoiding the additional duties levied by US Customs and Border Protection (CBP) and/or other Participating Government Agencies (PGA) at entry.
In addition to skirting tariffs, there is growing concern that this loophole allows for shipments of goods produced from forced labor to enter the US more easily, given the fact that they bypass the rigorous exams, inspections, and duties that the majority of brick-and-mortar–and even some online competitors–cannot dodge.
The Unintended Dark Side of De Minimis
Initially intended to facilitate smoother trade and Customs processes, this provision may now enable a more dubious practice: the potential for these tariff-dodging shipments to include goods produced through forced labor. This concern is not unfounded, given the complexities and opacities of global supply chains, especially those rooted in regions with poor labor rights records.
In 2022 alone, a staggering 685 million shipments imported into the US benefited from the de minimis exemption. Reports suggest that Temu and Shein combined are responsible for more than 30% of this volume. Now more than ever, consumers are attuned to the origins of the products they purchase and are demanding assurances that their spending does not endorse, or support forced labor.
The de minimis loophole underscores the critical need for transparency, accountability, and ethical considerations in global commerce. US lawmakers are now watching this performance with a critical eye, concerned not just about the loss of tariff revenue but also its darker implications.
Finding the Light at the End of the Legal Loophole
As the discussion around the de minimis provision and its unintended consequences unfolds, it’s clear that any path forward will require a collaborative effort. Lawmakers, businesses, and consumers alike must engage in an open dialogue to ensure that the benefits of e-commerce growth and international trade do not come at the expense of human rights.
The narrative surrounding Temu and the de minimis loophole serves as a poignant reminder of the intricate link between commerce, ethics, and legislation. While we navigate this playbook, let’s strive for a future where trade not only thrives economically, but also upholds the fundamental values of fairness, transparency, and respect for human dignity.
Helpful Links
By the dawn’s early light on March 26, we all saw that the Francis Scott Key Bridge had lost its perilous fight with the Maersk Dali. And then we viewed countless videos of the violent carnage, somehow almost graceful, surely caused by bombs bursting in air and not a bump from a boat!
Our second response was that this was certainly a hoax, a child’s trick using an erector set (do they still exist?) in a bathtub, right? Or was this the work of Russia, Iran, North Korea, or our new friends in Yemen? Fake news intended to frighten us? No.
The realities gave proof through that first night and day. This horror was all too real.
How did the Francis Scott Key Bridge collapse?
A vessel weighing more than a 20-story building, heavier than 1 million NFL football players, crushed a bridge pillar setting off a disastrous chain reaction. In their illustrious 28-year history, the Ravens have put about 1000 players on the field; it would take almost 300,000 years to collect one million Ravens to compete with the sheer bulk of the Maersk Dali.
Shapiro is proud to call Baltimore home for 109 years, and we know a few folks by now. So, the messages first came by phone, by text, by email, by Teams, by Linked-In, and by pony express. Was Shapiro’s flag still there? Is everyone okay? How many motorists perished? Was this all real?
After these heartfelt and almost primal inquiries, I expected to be asked about some of the following:
Are all terminals affected?
What will happen to the containers on port?
How many unladen vessels?
What is the trucking rate from Norfolk?
How much will the repair cost?
How quickly can the debris be removed?
Was that bridge safe?
Local road congestion realities?
Instead, I kept hearing versions of “is the sky falling, Rob?” Is the sky falling for the world, for the international supply chain, for Baltimore?
While I can’t begin to guess about the world’s fate (though I pray we remain the “land of the free”), I can give it a college try for the supply chain and for Charm City.
Okay, since 2017 more than 50 bridges have collapsed worldwide, Hanjin failed, labor unrest has steadily increased globally and in the US, the Ever Given put our business on the map, COVID changed ALL the rules for two years, the Panama Canal got thirsty, and the Houthis have entered our vocabulary by taking aim at anything that floats in the Red Sea. Frankly, my list here is astonishingly incomplete especially if we add the alarming violence of Mother Nature to the mix.
However, we must note that human ingenuity, determination, and genius is on full display with even a casual glimpse at the global supply chain. The Maersk Dali holds 10,000 TEUs of cargo and is less than half the size of the largest of mega vessels! Rail transport in many countries whizzes by at over 200mph. Manufacturing has never been more creative or systematic. Port equipment is not only energy efficient but “smarter” than ever. The distribution centers of today are absolute miracles of design and ingenuity. And, all the while, supply chains emit less sulfur and have begun to tackle our giant carbon problem (perhaps too sluggishly, but steadily).
Assessing Supply Chain Reactions
We are in the presence of unbelievable feats of engineering and human potential every single day. And I like to think that the human beings supporting global supply chains have never been more versatile, innovative, and connected. We are harnessing the powers of technology in more and more sophisticated ways on what feels like an hourly basis. The pace of change may be daunting, but it is also intensely inspiring if you take a deep breath and look at the bigger picture.
This leaves us with the final question, “is the sky falling for Baltimore?”
Let’s start with the Francis Scott Key Bridge itself. The bridge was not just a visual stunner, but it was a true wonder of engineering. It was the third longest continuous truss bridge on the planet, it took five years to build, 32,000 vehicles crossed it per day, and the full length of the construction was 1.6 miles. Bridge nerds have their rules, so only 15% of the bridge’s length counts as a truss. Today, the bridge looks like the ramparts o’er which Scott Key jotted notes, but the history is a proud one.
While we remember the rockets’ red glare over Fort McHenry, there was a notable lack of “red glares” on the bridge when it collapsed. We are devastated for the loss of the six construction workers, and we ache for their families; but local pilots called out the mayday, and the Maryland DOT blocked access to the bridge with lightning speed. The first vessel power loss was but five minutes before impact. If it had occurred at rush hour with no mayday, we might well be talking about hundreds of deaths.
Let’s move on to “The Star-Spangled Banner.” Written in Baltimore in 1814, our national anthem is all about the strength, courage, and the resiliency of Baltimoreans. Full stop. Francis Scott Key’s character has been challenged since he owned slaves, but his poem is an undiluted tribute to the great city of Baltimore.
When the great Key Bridge accepted her first vehicle in 1977, Baltimore City was still almost one million souls with about 70% of the total local population still in the city vs. the suburbs and surrounding areas. By 1980, the population of the city was down 17% from 1950’s peak. Today, we are down 40%. Yet, all the while the suburbs and surrounding areas have grown in population; the city is just over 20% of the area’s population today. Like it or not, we have been and are still abandoning Baltimore City.
Why? Well, a lowly forwarder with his modest margins ought to be careful here! Some people think the fate of the city was sealed when Maryland abandoned Baltimore and made her an independent city in 1851 (Charm City is still the nation’s largest independent city). Others may point to the creation of an expressway that separated the city, or to several recessions and at least four drug epidemics and counting. Some of the brave from the home of the brave believe that racism continues to play its pernicious part.
Yet today, we see so many signs of a vibrant eclectic population and culture from the arts to cuisine, to state and local government. And, all the while, Baltimore’s port has served up so much human variety and influence as to make Baltimore a poster child for America’s claim of “melting pot.”
Because Baltimoreans are proud, I shouldn’t risk this, but one easily finds the established splendors of African, German, Polish, Greek, Italian, Irish, Lithuanian (!), and Russian cultures among many others. Recent immigrants from Asia, Latin America, Africa, and the Middle East only add to the diversity and deep flavors of this melting pot.
Let’s drill down a little more and mention that the supply chain professionals in this region, those who are the heart and soul of Baltimore’s maritime identity, are a remarkable bunch of people. They say it takes a village, and we are a vocal, engaged, and caring village to say the least! From the dock workers at the port of Baltimore to the truckers and warehousemen to the railroads to the bridge repairmen to the shippers to the port executives to the AMAZING brokers and forwarders, to the government officials to the countless specialists like harbor pilots, to Michele Nickoles (yeah, I said it!), this is a remarkable community, an exceptional village!
This is NOT the twilight’s last gleaming for Baltimore. We have the broad stripes of an ethnic melting pot since 1729, and the bright stars to revive our vital role in global supply chains. We must remember to be very proud indeed from where we hail. We proudly hail from Baltimore, people!
Oh say, can you see a revitalized Baltimore, courageous and proud? Yes. Oh say, can you see a city and a port that is greater as a whole than the pieces we represent? Hell Yes! We are gallantly streaming to a better future, and we are doing this as a family, as a village, and as a great city.
Logistics contingency plans are just a fancy way of conveying the importance of businesses being prepared when the ship hits the fan—like if the Ever Given lodges itself at the Suez Canal or a viral pandemic hits planet Earth like a meteor, somehow super-charging global consumerism.
In 2021, an estimated 40% of all global ocean bookings were delayed or rolled from March to May, which caused carriers to deploy wave after wave of blank sailings to help get vessels back into their proper rotations. Covid was one gigantic contingency plan: global shippers placed their contracted cargo with their intended carriers just 50% of the time, and they paid the rates they expected for just 10% of all bookings! 2023 saw a return to stability and rational planning, but here comes 2024…!
Currently, we see two main assaults to your well-crafted supply chain plans, scholarly shippers: Panama and Suez Canal-sequences and ILA Labor Pains.
Panama & Suez Canal-sequences
Please have a look at the global ocean routing map and supporting data points below, comparing expected transits from Base Ports in Asia to Base Ports on the US East Coast (USEC):
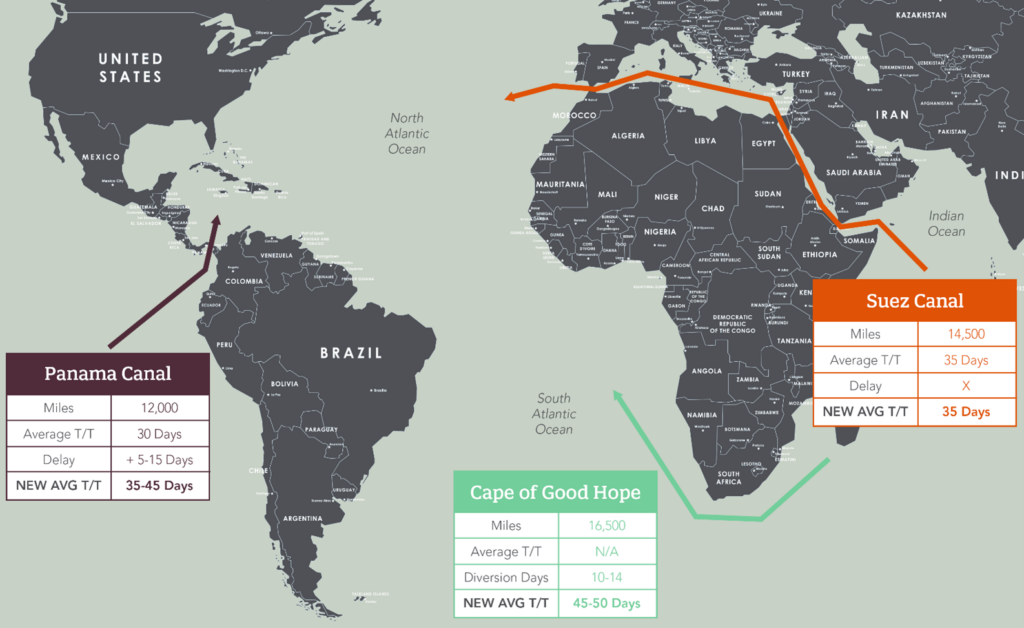
- Approximately 30% of global cargo volume transits the Suez.
- In normal times, about 35% of USEC volumes utilize the Suez.
- Ocean rates have doubled in a month, despite only modest seasonal demand growth.
- Not to mention the Emergency Risk (Suez) and Emergency Drought (Panama) Surcharges…oh my…!
- 17 of the 23 main service routes from Asia to US utilize Panama.
- Of the 17 services, 4 have returned to Panama after attempting Suez routing.
- 24 ships may transit Panama’s locks each day—which is just 67% of normal capacity.
So, what are we all going to do if Iran continues to fund the Houthis in the Red Sea and Mother Nature continues to deprive Panama of her ship carrying rains?
ILA Contractions & Labor Pains
Early news reports of International Longshoremen’s Association (ILA) contract renewal demands for the US Gulf and East Coast indicate very high wage and benefit expectations and zero automation tolerance. What can we do in the case of a major strike?
After prayer, meditation, and yoga, we have to begin with these fundamental questions:
- What happens to my production lines and inventory levels if my shipments are delayed?
- What additional fees might be imposed on my shipments by the lines?
- What if I can’t secure cargo space?
- What are the pros and cons of alternative cargo routings?
- Does my insurance cover delayed or rerouted shipments?
- What can I expect for ocean freight levels after Chinese New Year?
- Am I prepared to move some of my cargo by airfreight?
- Do I have the right partners in my supply chain who can give me access to both canals and all ocean carrier alliances?
- Have I investigated alternate product sourcing options with avoiding canals in mind?
- Should the ILA strike, what USWC options have I established in advance?
- Have I budgeted for contingencies? For example, if I ship zero containers over the West Coast through August, how will I expect to get space there after a strike?
The current global political and climate realities make it clear that proactive planning is crucial. But how does one go about creating an effective contingency plan?
Things to Consider When Creating Your Contingency Plan
Let’s dive into the practical steps and considerations that should be evaluated for your unique situation:
- Risk Assessment of Supply Routes: Assess risk by identifying potential vulnerabilities in your supply chain. Consider factors like geographical positioning and risks, political stability of trade routes, and dependency on key channels like the Suez or Panama Canal.
- Inventory Management: Determine the optimal level of safety stock for key products to buffer against supply chain disruptions. Diversify your supplier base to avoid disruptions in the event of trade tensions as recently seen with the US and China. Forecast demand of product to adjust inventory levels ahead of important seasons.
- Scenario Planning: Develop scenarios for various types of disruptions, ranging from natural disasters to geopolitical tensions. Consider the likely impacts on your routes, timelines, and costs.
- Alternative Routes and Modes: Map out alternative shipping routes and modes of transport. Evaluate the feasibility, cost implications, and transit times of each alternative. A mix of options is crucial as plan B can often become unavailable as we are seeing today with the Suez Canal.
- Contract Flexibility and Insurance/Liability: Negotiate contracts/deals with carriers/NVOs that allow for route flexibility and ensure that you have a comprehensive understanding of insurance coverage and the liabilities you have connected to the delivery of product.
- Leverage Technology: Technology, like Shapiro 360°, plays a pivotal role in being able to track shipments in real-time to reroute cargo and manage schedules as soon as possible. These indispensable tools help mitigate the risk of disruptions.
Contingency Consequences & Conclusions
Developing a comprehensive plan is important but it’s equally important to ensure your plan remains relevant and effective. Normally, reviewing your plan on a semi-annual or annual basis does the trick. For 2024, we recommend monthly reviews—especially considering the on-going canal concerns. This will give you the opportunity to update your tactics and strategies in concert with the latest market trends, technological advancements, and changes in trade policies (to say nothing of global geopolitics and Mother Nature…!).
We understand that the complexities of contingency planning can be overwhelming. If you feel daunted by the prospect of developing or updating your contingency plan, you don’t have to go it alone. Shapiro’s team of experts is here to guide you through every step of the process. Contact us for personalized support and guidance to be prepared for any challenge that may arise.
Helpful Links/Related Topics:
- Navigating the Suez Blockade: A Trade Tirade (ShapBlog)
- Panama and Suez Canal-sequences (ShapTalk)
- Hot News Page | Labor Strikes
Chinese New Year (CNY) is just around the corner—which means the mundane rhythm of everyday life will soon give way to a vibrant celebration of family and cultural traditions. Beginning Saturday, February 10, 2024, not a single soul will be found in factories or offices, as the Chinese workforce enjoys a week (or more) of respite—oftentimes away from the large, bustling cities. Instead, the streets of China will be transformed and adorned with red lanterns, children’s paper decorations in every window, and parades in honor of “The Year of the Dragon.”
With the number of “Made in China” tags embroidered and/or stamped on so many global products, you probably won’t be surprised to learn that China accounts for approximately 11-14% of all U.S. imports (depending on your data source). Why are we telling you this, you might ask? Because the annual CNY shutdown leads to a temporary, yet notable slowdown in manufacturing, and more importantly—affects exporting activities.
Typically, CNY falls anywhere between January 21 and February 21, though the specific timeframe varies from year to year depending on the lunar calendar. However, regardless of the specific dates, there is always a noticeable surge in manufacturing and shipping activity out of China leading up to the holiday, as exporters scramble to find available bookings and shipping capacity before the hiatus begins.
Although one can never take trends as gospel in the shipping world, there is value in observing past data. Let’s take a quick peek at some of the peaks (rather troughs) of post-CNY rate changes over the past decade—minus the messy period we call COVID-19.
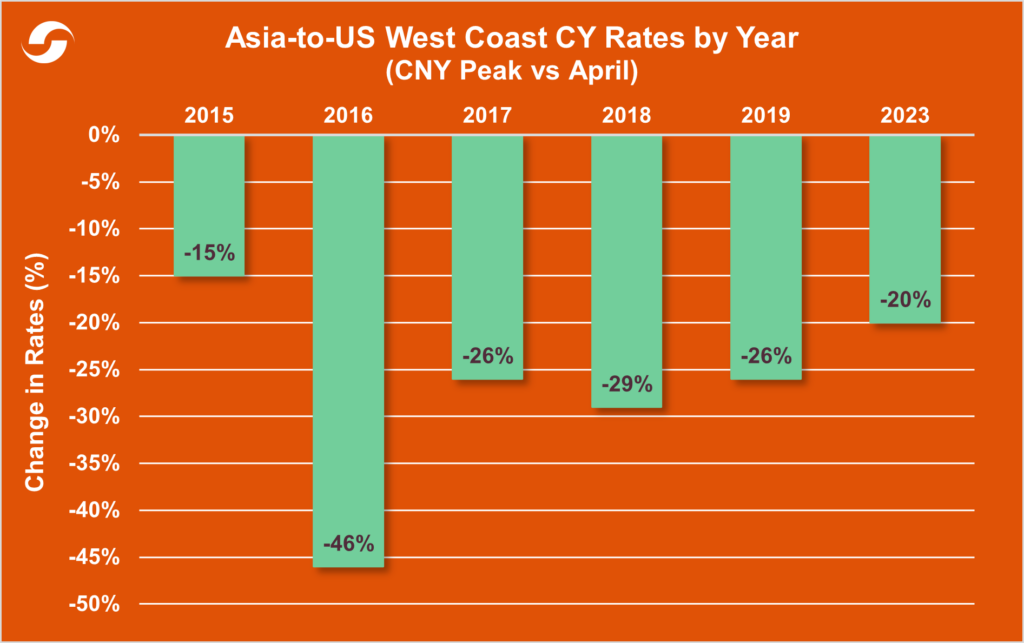
Long story short: If you can avoid the pre-CNY shipping parade, you’ll likely be able to score some unused container space at a nice post-holiday “discount.” So, be sure to mark your calendars well in advance and prepare to ship smarter—not harder. Because in our business, it can really pay-off to know not just how to make your move, but when.
Editor’s Note: First, let us say that the humanitarian impacts and terrifying possibilities of a raging geopolitical storm leading to a global conflict are what really matter when eyeing Gaza. That is a concern well beyond this blog! We write this in the spirit of the annual budgets we are preparing (or will soon be preparing), and our businesses.
What the heck are we international shippers all going to do when the Suez Canal is blocked or compromised by the current and broadening conflicts in Gaza, Israel, and beyond?
Let’s start this tirade in Panama—the slightly more famous canal among the proud Americans who financed that impressive project back in 1914. Yikes! First, the Panama Canal Authority (PCA) lowered the maximum (max) draft levels from 50 to 44 feet, which limits max vessel sizes. Since then, the PCA has already reduced the number of vessel transits per day from 36 to 32 (in July) to 24 (in November), followed by an announcement that the daily max will drop to 18 by February 2024!
Hey, no problem, we’ll just pay a few dollars more to wait a few days longer for Suez routings, right? …Right? …Maybe wrong.
Here are a few fun facts to help put things into perspective for us:
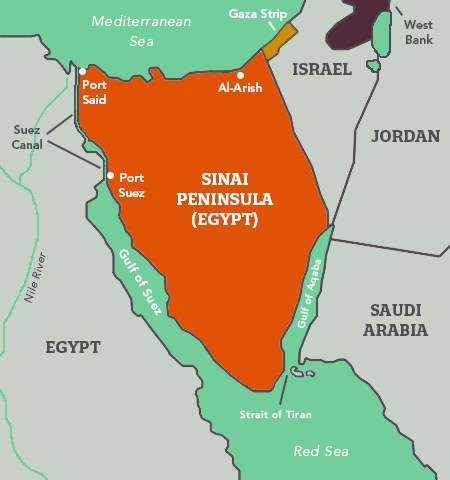
- Philadelphia is farther from Washington DC than the Gaza Strip is from the Suez Canal.
- 130 slender miles separate the infamous Refah border crossing in Egypt’s Sinai and the busiest and eldest major canal on planet Earth.
- Al-Arish Airport, the primary hub for humanitarian shipments for Gaza is 28 miles from the Refah border, separating the Gaza Strip from Egypt.
- The Suez is not only 45 years older, but also 244% busier than our darling Panama Canal!
- Remember, both sides of the noble Suez sit on Egyptian soil.
So, we are all in trouble obviously! Have you considered a world where Iran, Egypt, and Saudi Arabia gang up on Israel, and the Suez is closed indefinitely?
…Not so fast, reactionary readers. You don’t want to be “Egypted” off when seeking your supply chain information!
Enter Egypt
Before we delve into the current situation, let’s briefly review a few of the region’s defining moments over the past century that helped shape the present political context at hand:

Analysis of the Hamas-Egypt Relationship
Today, it is said that the official position of Egypt is negative toward Hamas because they are literally the offspring of the Muslim Brotherhood. This organization has done much harm to Egypt in the eyes of many after what’s amounted to nine years of military rule under Abdel Fattah el-Sisi. That said, there is tremendous popular support for Hamas among the people—and most Egyptians would not like to see Palestinians, perhaps even members of Hamas, suffer.
Egypt is also closely allied with both the United States and Israel, and these connections run deep and wide, as they pertain to financial aid and developmental support for Egypt. A telling example of this cooperation is the ongoing blockade of vessels to and from the Gaza Strip. And, frankly speaking, the Suez Canal is a huge economic contributor for Egypt. It is very hard to imagine Egypt attacking Israel any time soon. They now have many ties that bind, and Hamas is hardly seen as saintly in the eyes of Egypt.
Wild Card: Freight Rates
What happens if Iran or her many “seedlings” like Hezbollah take aim at the Suez?
The short-term consequence—especially if Panama is as dry as a desert—is that we all get to know (and love) the Cape of Good Hope around South Africa. Our freight prices will increase by 100% and our transits will extend by as much as 50%, but we’ll still be in business. As of today, that seems like the worst-case shipping scenario; though, if we get there, the world is in CONTAINERLOADS of trouble.
Suez Blockade Tirade Conclusions
What’s Shapiro’s outlook on the matter?
We feel that it’s likely that some Panama Canal business would start to move by rail from Cristobal to Balboa if the Suez is blocked and rendered useless. Our bet is it is a 1% chance. However, if it comes to that reality, just know that Panama’s rail connections from the Pacific to the Atlantic have never been faster, more reliable, or more affordable than today. By hook and by crook, even if we must use western Mexico, we’ll be routing freight to every single boy and girl in the US.
Again, our point is not to diminish the anguish occurring in the Middle East. An unprovoked attack followed by even more human suffering: it is impossible to label this anything but a tragedy. But it would be foolish not to consider potential dire developments. Shifting our focus to commerce, we’re betting on a resourceful global supply chain in 2024!
Itching to weigh in on our little tirade and/or rant about your current escapades? Contact Shapiro today!
Helpful Links/Related Topics:
- More Global Shipping Delays After Suez Canal Saga
- The Worst Suez Market Allocation ‘Ever Given’
- Everything You Need to Know About the Vessel Blockage at the Suez Canal
- The Vessel Blocking the Suez Canal has been Dislodged
- You Can’t Ship Out In a Drought
- The Portly Problem of Climate Change
- Nautical Nose-to-Tail At The Panama Canal
Shipping Line News
- The Alliance has suspended its EC4 service, which covers Kaohsiung, Xiamen, Hong Kong, Yantian, Cai Mep, Singapore, Norfolk, Savannah, Charleston, Newark-New York, and Singapore.
- “Green” ships (methanol-powered and/or dual fuel) continue to be produced in keeping with the large orders placed in 2022 and the beginning of 2023. These orders total 187 ships and represent a total capacity of 1.75 mTEU.
- The total number of idled carrier vessels is now 315, totaling over 1.18m TEU.
Blank Sailings Up Dramatically
- Blank sailings continue to increase on the eastbound trans-Pacific in an attempt to establish control over spot rates.
- This has effectively reduced capacity by an estimated 22%, compared to just an 11.5% reduction in September.
- Delays of up to 14 days have been reported due to rolled cargo.
- Amid this persistent and widespread rate pressure for US shipments, intra-Asia import trades to India are up a whopping 40% in the last three months.
- This uptick is causing liners to increase their port calls along with sending bigger vessels on the route.
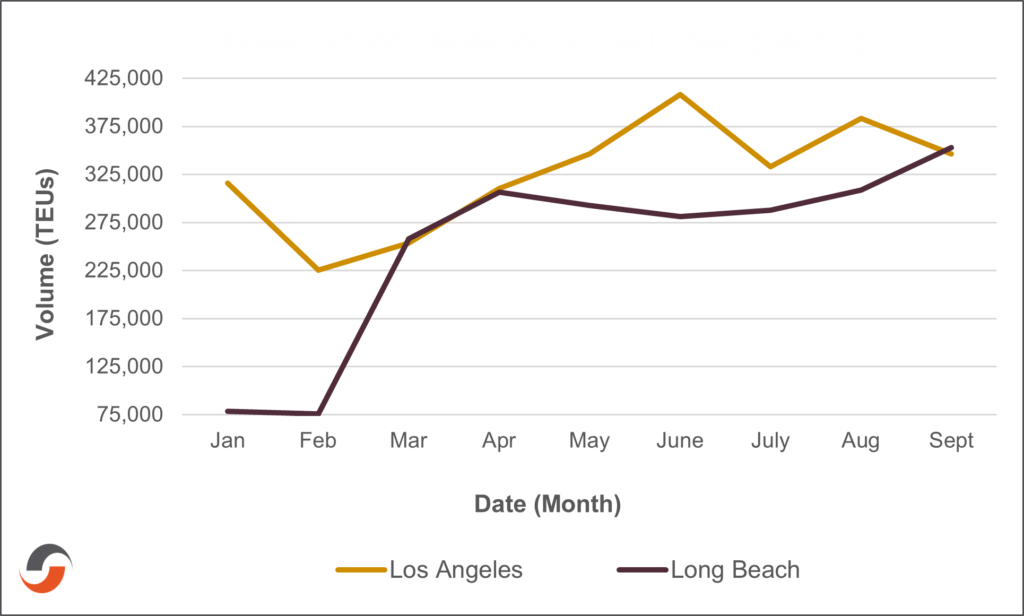
Container Volume Asia to US East Coast Ports (2023)
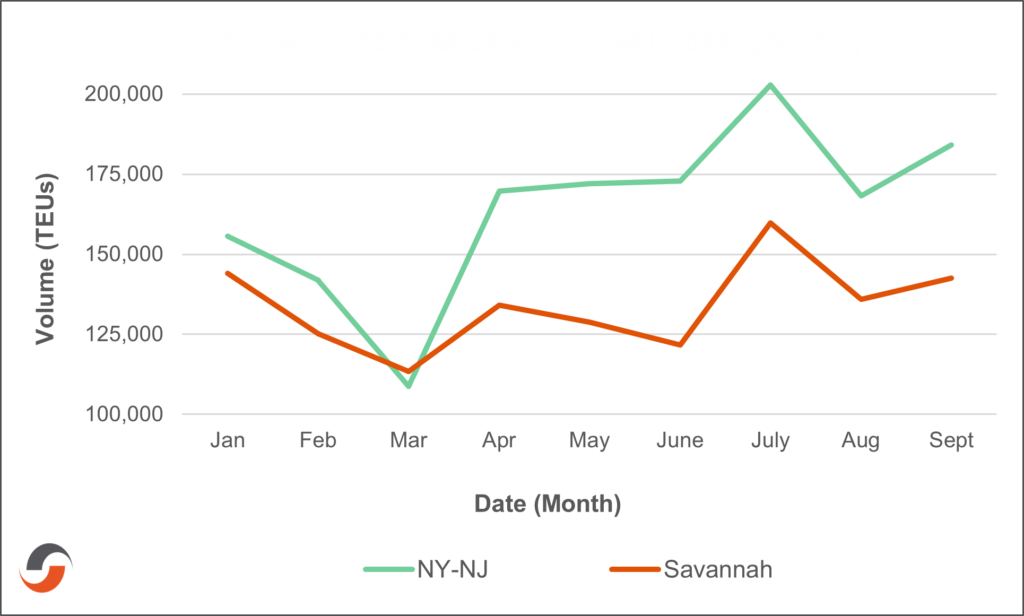
Container Volume Asia to US West Coast Ports (2023)
In a world already fraught with frightening freight challenges, shippers are now grappling with a bone-chilling new threat that haunts their every waking moment—a rising number of cargo thefts. Statistics reveal a total of 566 incidents documented this year, marking a spine-tingling 56% year-over-year increase. These thieves, driven by an insatiable appetite for cash, target a wide array of commodities, ranging from high-end electronics to essential construction materials and coveted sneakers, akin to a wicked assortment of Halloween candy. The startling reality is that these robberies have amassed a staggering total value of over $40 million, at an average of $260,000 per theft.
But these spectral criminals aren’t content with lurking in the shadows; they’ve established their ghoulish dominion near bustling hubs and cities. Among these locales, California and Georgia have emerged as the principal settings for this spooky saga. In an audacious display, some of these larcenists are causing entire truckloads to vanish. They are orchestrating fake pick-ups with unsuspecting drivers, leaving only a ghost behind in their wake.
Most of the purloined goods find their way to the darkest corners of the black market, fetching a mere 15-20% of their actual value. However, certain items, such as electronics and high-demand shoes, are stealthily maneuvered onto online platforms like eBay and Facebook Marketplace, often fetching prices that equal or even exceed their MSRP.
The Environmental Skeletons in the Global Closet
We guess you may have read about global warming or watched a docile tropical storm rage into a Class 5 hurricane in a day, or maybe you have floated into your own backyard on your sofa. Call it what your political party insists, but there should be a skull-and-crossbones warning label on much of our planet.
Your cargo has never been haunted by so many potential ghouls along the treacherous path of your supply chain. Forty percent of global ports (those that handle 60% of the world’s cargo) are already in potential jeopardy from rising water levels. Vessels and aircraft have never faced choppier seas or more violent turbulence. Floods, typhoons, droughts, hurricanes, fires, and witches all lurk, and many companies just aren’t even close to ready.
Like a giant Jack-o-Lantern, complete with a crooked grinning jaw, the Earth is laughing at your vulnerable cargo and your skimpy property policy. Yes, the one that “claims” to cover cargo claims!
Ward Away the Shadows with Cargo Insurance
Fear not, for there’s a solution to ward off the impacts of these sinister spirits: cargo insurance. There are many benefits to cargo insurance. Here are a few examples:
- Financial Safeguard: Cargo insurance serves as a safeguard for your investments, creating a protective barrier that shields you from potential financial issues in the event of theft or damage during transit.
- Risk Mitigation: Insurance can give you peace of mind in moving expensive or large shipments. If something does happen to the cargo, the risk is mitigated in terms of realized losses.
- Operational Continuity: Having cargo insurance in place for a shipment expedites the claims process, ensuring that losses are recovered swiftly. This reduced processing time helps to minimize operational disruptions since new goods can be on their way more quickly.
- Competitive Advantage: It is more than just protection; it is a statement of professionalism in the world of international trade. Your clients and partners will view your business as responsible and reliable.
What Goes in this Perfect Potion?
Things to consider when choosing cargo insurance:
- Coverage Scope: When selecting cargo insurance, it’s imperative to ascertain that the policy is tailored to your unique risks. For example, if you’re importing delicate porcelain china, your policy should explicitly cover damage due to handling or breaking during transit.
- Policy Limits: Review the limits of coverage to ensure they align with the value of your cargo. The coverage should reflect the true value of your shipments.
- Deductibles: Be aware of the deductibles you’d be responsible for in case a claim is made. Knowing the deductible amount is crucial, as it directly impacts the out-of-pocket expense in case of a claim.
- Claims Process: Investigate the ease and efficiency of the claims process with your chosen insurance provider. If you’re importing perishable goods, a swift and straightforward claims process is vital, as delays could result in significant losses.
- Customization: Look for cargo insurance policies that can be customized to suit your specific requirements around handling, transportation, etc.
To safeguard your imports and ensure the continuity of your operations, cargo insurance is an indispensable tool, especially with thefts on the rise. By choosing the right policy, you can protect your investments, mitigate risks, and gain peace of mind. If you’d like assistance in obtaining cargo insurance, book an appointment with our logistics experts today!
It’s no secret that the decline of cable television has given rise to a new entertainment behemoth: streaming platforms. The resulting power struggle forced network executives to rethink the wheel to attract more viewers than their competitors, and in turn, more advertising revenue. One of the tactics that’s taken centerstage is based upon the age-old adage, “give the people what they want.” Well, it turns out that people want more true crime documentary series.
Why is this relevant, you may ask? Because much like this genre, regulatory compliance is riddled with dynamic complexities, unexpected twists, minute details, and probing questions—especially when it comes to classifying your products. Classification doesn’t have to be an unsolvable puzzle or a “bored” game. So, watch out Colonel Mustard—Shapiro is here to decipher the clues and crack the classification code!
HS v. HTS codes: What’s the Difference?
The easiest place to start is with HS codes. Harmonized System (HS) codes help declare the identity of goods to the various importing countries’ customs offices. They were developed by the World Customs Organization (WCO) to standardize global trade and have since become a well-established practice worldwide. HS codes consist of six digits and are updated every five years.
On the flip side, the Harmonized Tariff Schedule (HTS) is a numerical code that helps customs officials, shippers, and traders alike decipher the complex language of cross-border goods. HTS codes expand the six-digit HS code to ten digits and are managed by the US International Trade Commission (ITC). When importing a product, a shipment will be assigned an HTS code, and the shipper must ensure that it corresponds with the country codes of importation. Much like an airport, HTS codes act as international passports that guide your product through different tariffs, duties, and regulations; and Customs officials are the terminal security agents who ensure passenger compliance with standard regulations.
Hacking and Cracking the HTS Code
If you’ve been keeping up with the news lately, you may have heard about the recent wave of password crackdowns that streaming services have implemented in an effort to combat shared accounts. But how do companies like Netflix and Disney+ know when multiple people are using a shared account? Easy—by monitoring Internet Protocol (IP) addresses, which are the numerical labels that uniquely identify network interfaces and specific locations. Just as your internet modem has a unique numerical address, so do your products.
As we discussed above, HTS codes have ten digits; with the first six digits corresponding to the HS code. Here’s a breakdown of the code and what each portion represents:

- Chapter: There are 21 distinct sections split into 96 chapters. Although the HTS technically includes Chapters 1-99, there are three exception chapters omitted from the total count:
- Chapter 77 (Reserved for Future Use) is blank.
- Chapter 98 (Special Classification provisions) is limited to national use.
- Chapter 99 (Temporary Legislation; Temporary Modifications; Additional Import Restrictions) is a specific code limited to temporary modifications and national use.
- Heading: Dictates the specific category within any chapter.
- Subheading (HS code): The last two digits are more specific and define the subcategories of products.
- Subheading: For the US, the seventh and eighth digits represent the country specific sub-heading.
- Statistical Suffix:The last two digits identify country-specific categorization.
To help keep track of rulings and classifications, U.S. Customs and Border Protection (CBP) has a database—known as the Customs Rulings Online Search System (CROSS)—which can be used to search for US HTS codes and rulings dating back to 1989. If you’re interested in reading a few fast (and fun) facts about the latest and greatest US HTS edition (2023) from the ITC, click here.
Hacking and Cracking the HTS Code
If the HTS process wasn’t complicated enough, the US also uses a separate ten-digit code to denote exports, known as the Schedule B number. The US Foreign Trade Division is responsible for assigning a Schedule B number for every product exported out of the country. As with the HTS codes, the first six digits are the global HS number. For help pinpointing your products, check out the Schedule B Search Engine, or contact us directly!
Get a Clue on Tariff Engineering
Tariff engineering can often feel like a game of Clue. It’s all about taking stock of what’s in front of you, asking the right questions, and finding the right nooks and crannies in the tariff schedule. By adjusting the design of your product, you can legally optimize your import duties and avoid paying the proverbial troll under the bridge trying to eat into your profits.
As a great example, a popular shoe company includes layers of felt on the sole. They ensure that the felt covers 50% of the sole, which allows them to classify their imports as slippers instead of shoes. Tariffs for slippers range between 7.5% to 12.5%, while regular footwear with rubber soles can have duties of 37.5% or higher. The pennies of felt and labor to change the code certainly seem worth the tradeoff.

Spilling the Penal-Teas on Apparel
Textile imports can be classified under roughly 5,500 different HTS codes in the U.S. With each item falling under a specific ten-digit heading subject to change every five years, you may find yourself in an exponentially more complicated situation than you signed up for. To give you an idea of just how much HTS codes can cause duties to vary, there is a 27% difference between declaring apparel as “silk” (0.9% tariff) and “other” (28% tariff). These codes can make a huge difference to the bottom line of an importer and should be evaluated by an expert. When it comes to classifying, there’s no room for ex-SKU-ses. Even the smallest of errors can quickly spool out of control, causing your whole supply chain to unravel. If you don’t believe us, then try this one on for size…
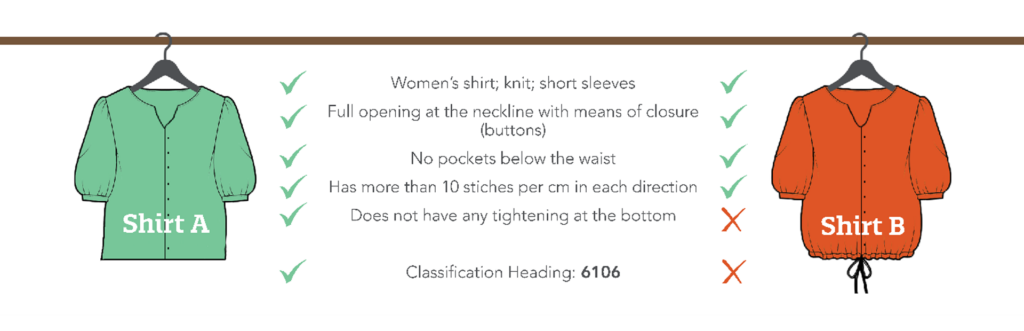
You might be thinking, “it’s just a tiny piece of fabric, what’s the big hang-up?” Well, the moral of our tale of two retail shirts is simple: don’t let negligent knit-wits take you to the cleaners. If Customs officials end up flagging the misclassification or FTA needle in the entry haystack, then Shirt B could cost Twead-ledum (the retailer) penalties amounting to 20% of the dutiable value, double the loss of lawful duties, taxes and fees, or much worse!
Shapiro’s best practices are outfitted in reasonable care. With over 100 years in the business, we’ve discovered that one size doesn’t always fit all; and we’ve learned to expertly stitch together solutions that are tailored to your needs.
How Shapiro “CAM” Help You!
Classification questions can be daunting; which is exactly why CBP recommends against do-it-yourself use of the HTS classification system and also why robo-classifications (classifications performed by computers, programs, and software systems) tend to be accurate less than 50% of the time! Incomplete descriptions or classification errors are costly mistakes that can result in additional duties, delayed cargo release, and penalties.
Shapiro offers an excellent tool to help importers streamline their classification process. Our Classification Advisory Module, or “CAM,” is a one-stop resource for classification. Our skilled compliance detectives use their 250 years of combined experience to research, analyze, and classify each request. Pre-classification is a great way to forecast landed costs and reduce unnecessary research. To get in touch with a member of our classification crew, contact Shapiro today!
Don’t Get Caught!
Regulatory Compliance: There are two simple steps to avoiding trouble: First, know the rules. Second, don’t break them. The potential penalties, both financial and commercial, can be extremely damaging for your business and, in some cases, for you personally. Let’s agree that regulatory compliance isn’t a flexible issue but Shapiro can straighten you out!
PICTURE THIS…It’s 1973. You’ve just arrived at your health-conscious Uncle Larry’s house for the weekend—and are less than enthused when you hear all about the new superfood blender that your uncle won in a raffle at his gym. He then proceeds to offer up one of his “World Famous Larry-aids,” which is loaded with fruits and veggies, and is guaranteed to make you a “lean, mean, fighting machine.” What do you do?
Let’s be real—back in ‘73, most people would have had to fight off a look of sheer horror at the prospect of having to drink something that tasted like feet—and then proceeded to politely decline. But fast forward to today, and the response would probably be much different.
Just as the food pyramid has evolved to promote a healthier lifestyle over the last 50 years, so too has the importance of sustainability in bettering the planet.
Take the shipping industry, for example, which has long relied upon massive steamships to traverse the world’s oceans, thereby producing significant carbon and sulfur emissions. The resulting environmental decay has contributed toward the relatively recent emergence of green organizations—such as the Global Reporting Initiative (GRI), the International Maritime Organization (IMO), and the Sustainability Accounting Standards Board (SASB)—thereby enabling us to navigate the treacherous and uncharted (and filthy!) waters with our global partners.
If you haven’t heard about some of the latest and greatest green global initiatives yet, then sit back and enjoy the “smoothie” sailing, as we set the course on “clean, green, pollution-fighting marine machines.”
It’s a Bird, It’s a Plane…No, It’s Ocean Sustainability!
As the saying goes, “birds of the [Exxon Valdez Oil Spill] feather flock together.” (Okay, yes, we might have taken a few liberties there, but we thought we would try to be “slick” and lighten the mood before we “spill.”) Has a little birdie from a flock of “sea”-gulls—ever told you about the 11 million gallons of oil that leaked from a tanker that had run aground in Alaska back in 1989? If not, then you are likely unaware of the environmental devastation that the Exxon Valdez Oil Spill caused.
The resulting public outcry was so sweeping that it led to the establishment of the Global Reporting Initiative (GRI). Although the GRI is completely independent, it acts as a compass, providing a sustainability reporting framework for companies, allowing them to disclose certain environmental, social, and governance impacts. In a nutshell, the GRI provides shippers with the ability to constructively compare apples-to-apples when it comes to core sustainability progressions.
It wasn’t until the 1990s that “sustainability” became a buzzword. CEOs went unchecked for years as they shouted it from the rooftops in the name of soaring stock prices.
In those days, there was little to no oversight or ability to compare the effectiveness of sustainable initiatives from company to company. It wasn’t until the Sustainability Accounting Standards Board’s (SASB) debut in 2011 that companies were able to measure, manage, and communicate the most relevant and impactful factors to their industry, also known as Environment Social Governance (ESG) factors. Here’s a birds’-eye-view of a few ESGs:
View Environment Social Governance Chart
| Topic | Metric | Category | Unit of Measure |
| Greenhouse Gas Emissions | Gross global Scope 1 emissions | Quantitative | Metric tons (t) CO2-e |
| Discussion of long and short-term strategy or plan to manage Scope 1 emissions, emissions reduction targets, and an analysis of performance against those targets | Discussion & Analysis | N/A | |
| Quantitative | Gigajoules (GJ), Percentage (%) | |
| Average Energy Efficiency Design Index (EEDI) for new ships | Quantitative | Grammes of CO per ton- ₂ nautical mile | |
| Air Quality | Air emissions of the following pollutants:
| Quantitative | Metric tons (t) |
| Ecological Impacts | Shipping duration in marine protected areas or areas of protected conservation status | Quantitative | Number of travel days |
Percentage of fleet implementing ballast water:
| Quantitative | Percentage (%) | |
| Quantitative | Number – Cubic meters (m³) | |
| Employee Health & Safety | Lost time incident rate (LTIR) | Quantitative | Rate |
| Business Ethics | Number of calls at ports in countries that have the 20 lowest rankings in Transparency International’s Corruption Perception Index | Quantitative | Number |
| Total amount of monetary losses as a result of legal proceedings associated with bribery or corruption | Quantitative | Presentation currency | |
| Accident & Safety Management | Number of marine casualties, percentage classified as very serious | Quantitative | Number – Percentage (%) |
| Number of Conditions of Class or Recommendations | Quantitative | Number | |
Number of port state control:
| Quantitative | Number |
The above ESG standards emphasize materiality; this means they tend to focus on issues most likely to affect a company’s financials and shareholders. When you tie non-financial factors and incentives to performance, companies are more likely to take sustainability seriously—which ultimately trickles down and benefits society.
Synchronized Diving with the GRI and SASB
There are some things in life that are simply better together—such as peanut butter + jelly; bacon + eggs; or Beyonce + Jay-Z. When it comes to the ocean, there are few matches as “nauti”-cool as the compass and map. You can have one without the other, but both are more useful when paired together.
With this in mind, let’s imagine that the SASB standards function as the Sustainability Compass—which acts as a tool to help navigate the GRI Framework Map.
Realizing the incredible power of their complementary nature, in July 2020, both organizations teamed up to announce a collaborative work plan. Together, they aim to:
- Clarify the application of their reporting standards;
- Provide insight into how the performance data is used; and
- Help consumers of the data understand the similarities and differences in the information generated.
Over 96% of the world’s largest companies report on sustainability performance. It’s clear that the ripple effect from both organizations is starting to make an impact on a global scale.
The Ins- and Out-Comes of Sustainable Shipping
Peter Drucker took a page out of Patrick Henry’s book when he said, “Innovate or die.” While we don’t want to necessarily over-dramatize the situation, there have been many notable advancements in the industry over the last few decades—including hybrid engines, alternative fueling, slow-steaming coupled with route optimization, and utilizing sustainable packaging and materials.
Oftentimes, hybrid engine technology is a somewhat controversial table topic, especially if Uncle Larry still has his prized ‘76 Nova parked in the garage. Politically charged commentary aside, these engines offer a promising solution to minimize the carbon footprint of ocean vessels.
Did you know that ocean shipping alone is responsible for 15% of carbon emissions across the planet? Or that in its lifetime, a single ship contributes almost as much pollution as 50 million cars would? Taking advantage of hybrid technology is an easy double-win for companies. Not only does this reduce carbon emissions by up to 40%, but it also increases fuel efficiency by as much as 30%, resulting in a boatload of savings across the board… which results in another boatload of savings.
In quite the juxtaposition, the slow steaming of vessels has been quick to pick up speed in the shipping world. As its name suggests, slow steaming occurs when a vessel intentionally reduces its speed during transit to optimize fuel expenditure and reduce greenhouse emissions. Some experts estimate that this strategy can reduce fuel consumption by an average of 30% per trip. Much like the hybrid alternative, slow steaming can lower environmental impacts and cut fuel costs relatively effectively and quickly. Additionally, it puts less stress on the ship’s engine, which can extend its lifetime.
The Wrap-Up: Life in Plastic Ain’t Fantastic
Before we wrap-up on this topic, (or start rapping the rest of Aqua’s “Barbie Girl”), let’s quickly touch on packaging materials and methods that have entered the sustainability scene. It comes as no surprise that traditional packing approaches—like bubble wrap or polystyrene—have faced increased criticism in recent years due to the potential wildlife hazards they present, as well as their limited recyclability. Many companies have opted to use more environmentally friendly packaging materials, such as air pillows or recycled paper and plastics, when shipping their products.
As we head deeper into the twenty-first century, the days of massive steamships belching out noxious fumes grow fewer and fewer; however, the lasting trail of global emissions and pollutants remains firmly in their wake. Just like your Uncle Larry’s pursuit of health, the shipping industry is undergoing a transformative journey towards a more sustainable future on the vitamin “sea”— one that’s loaded with clean, green, pollution-fighting marine machine juices.